
Free and Open-Source CAN Logging and Plotting Stack
Working with a CAN bus stack can be intimidating for beginners. From the physical layer to the software tools, there is a lot to learn. There is also a huge barrier to entry – cost. The industry standard hardware interfaces and associated software are typically expensive: $10,000+ for the hardware and full software stack from top vendors. The logging, decoding, and plotting software tools are bloated with more features than the average system with a few electronic control units (ECUs) needs.
Through our experience in automotive, motor controller development, and custom powertrain development, we have built a workflow that:
Relies on cheap hardware (hundreds of $) paired with free and open-source software
Works for most logging and debugging use cases
There are three main steps to debugging an issue using CAN bus:
Logging: saving the raw data with timestamps and monitoring signal values in real-time
Decoding: extracting each signal’s data from the raw message data, typically using a schema such as a CAN DBC (database container)
Plotting: graphing the different signals so that you can decipher what went wrong

Make it stand out
Whatever it is, the way you tell your story online can make all the difference.
Raw CAN frames logged with SavvyCAN
For USB logging on stationary test setups (our most common test medium) our workflow needs to be a bit more complex to handle the different functions:
SavvyCAN for USB logging and real-time signal monitoring
Boron Energy’s open source CSV to MF4 converter tool
asammdfgui for high-fidelity plotting
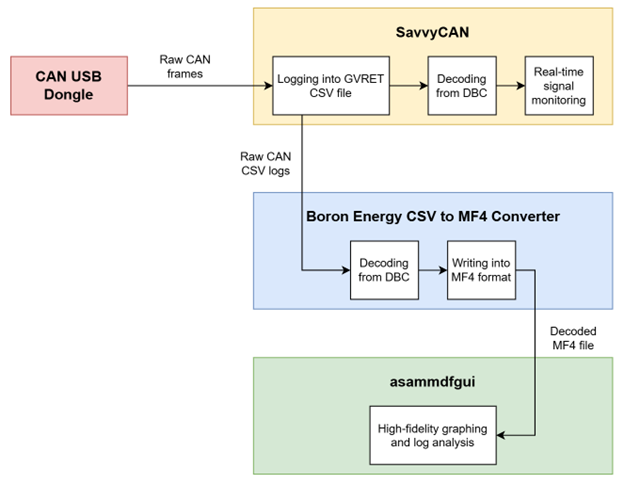
CAN software workflow from USB interface to graphing
We wrote and open sourced our own SavvyCAN to asammdfgui converter since we couldn’t find any libraries online. SavvyCAN is compatible with socketcan, Vector, PeakCAN, and TinyCAN interfaces. It is great for real-time logging/decoding and limited real-time graphing but lacks a good UI for debugging complex logs with many signals. This is where asammdfgui shines.
asammdfgui supports separating axes for each signal, locking a subset of axes together, locking axes for easy zoom/pan, X/Y cursor measurements, and so much more. The SavvyCAN GUI works well enough to monitor signals in real-time but doesn’t have any of these features. When you’re working with hours of log data with hundreds of signals, asammdfgui is the tool for the job. Bonus: it’s also fast and responsive with large data files (>100 MB), unlike SavvyCAN.
More info about the GVRET CSV format and the MF4 format.
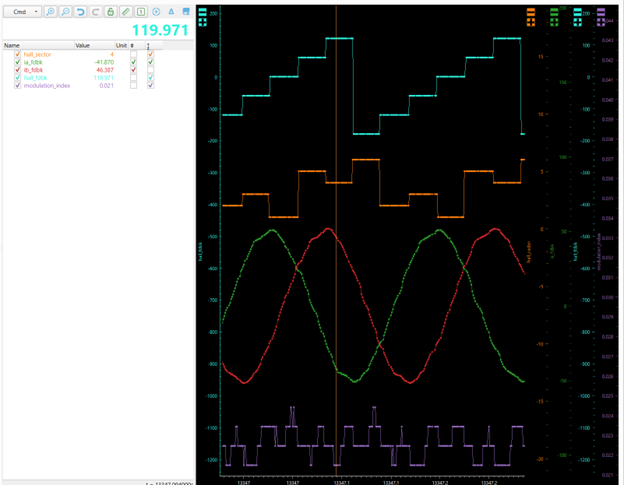
Plotting a CAN log from our BE4 motor controller in asammdfgui
An alternative to SavvyCAN is can-utils on a Linux CLI. You can setup your CAN interface with ip, log messages using candump, decode using cantools decode, and monitor signals in real-time using cantools monitor. I still prefer SavvyCAN as it can do more in real-time on the same Linux socketcan interface.
For on-board logs, asammdfgui does a great job by itself for both log decoding and plotting.
We have found these options to be the most affordable and capable CAN hardware for each use case. Everything is compatible with the software discussed above:
CAN 2.0 USB interface: PCAN-USB, $225 USD, €195
CAN FD USB interface: PCAN-USB-FD: $310 USD, €270
Supports up to 12Mbps
On-board logger: CANedge1 logger, $380 USD, €330
Logs to SD card, we use this for vehicle testing
2x CAN 2.0/FD, 2x LIN
Whether you need CAN 2.0 or CAN FD and if you need a USB interface or an on-board logger, you can affordably monitor your CAN bus using any of these hardware tools. Plus, our free software stack of open-source software tools completes the logging and debugging toolchain. We have had a lot of success using these tools internally to debug our own hardware. Even Cole, my fellow co-founder who comes from a mechanical engineering background is collecting great data with these. We want to use these tools to help you solve your hard problems too. Whether you need help debugging your CAN bus, or custom motor controller design, or full powertrain optimization, contact us to explore how we can help with your next project.